Can’t Prove Merch ROI to Your CFO? Track These Numbers
When budgets tighten, finance is one of the first things to reconsider. That’s because tracking merch ROI is hard. I’ve had clients come back after an event asking how to report on their merch, and by then most of the useful data is already gone. In this blog, we’ll share ways to track the ROI from your event giveaways.

Why merch is harder to measure than ads
Compared to ads and other marketing initiatives, proving your event giveaways were successful is harder. Even we at Cubic Promote struggle with proving the merch we brought to a trade show we exhibited is a success. And here are the reasons we’ve observed:
- It works over months, not in a single click or session.
- Recipients rarely remember where they picked something up.
- The spend often sits in an event or HR budget while the results land in the sales pipeline.
- Leftover stock hides real cost unless someone counts it.
The six numbers worth tracking
What To Decide Before We Start Branding
Before we start production, bring up that you want to measure ROI in your first conversation with us. This allows us to suggest tracking methods for your campaign.
Tie every item to a code or a list
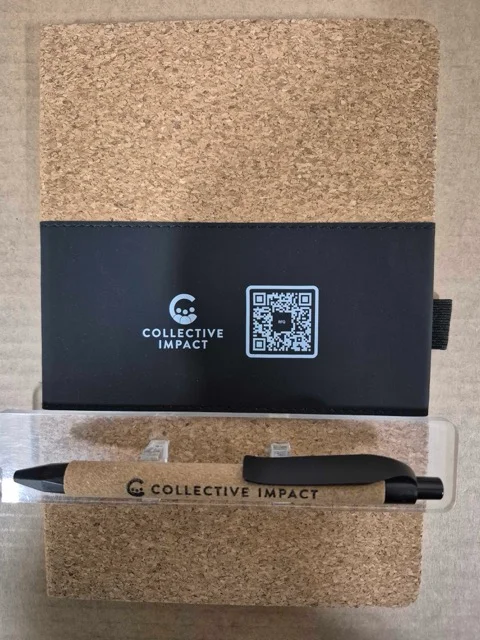
- Add a QR code or short URL to the pens, for example, on a swing tag or packaging.
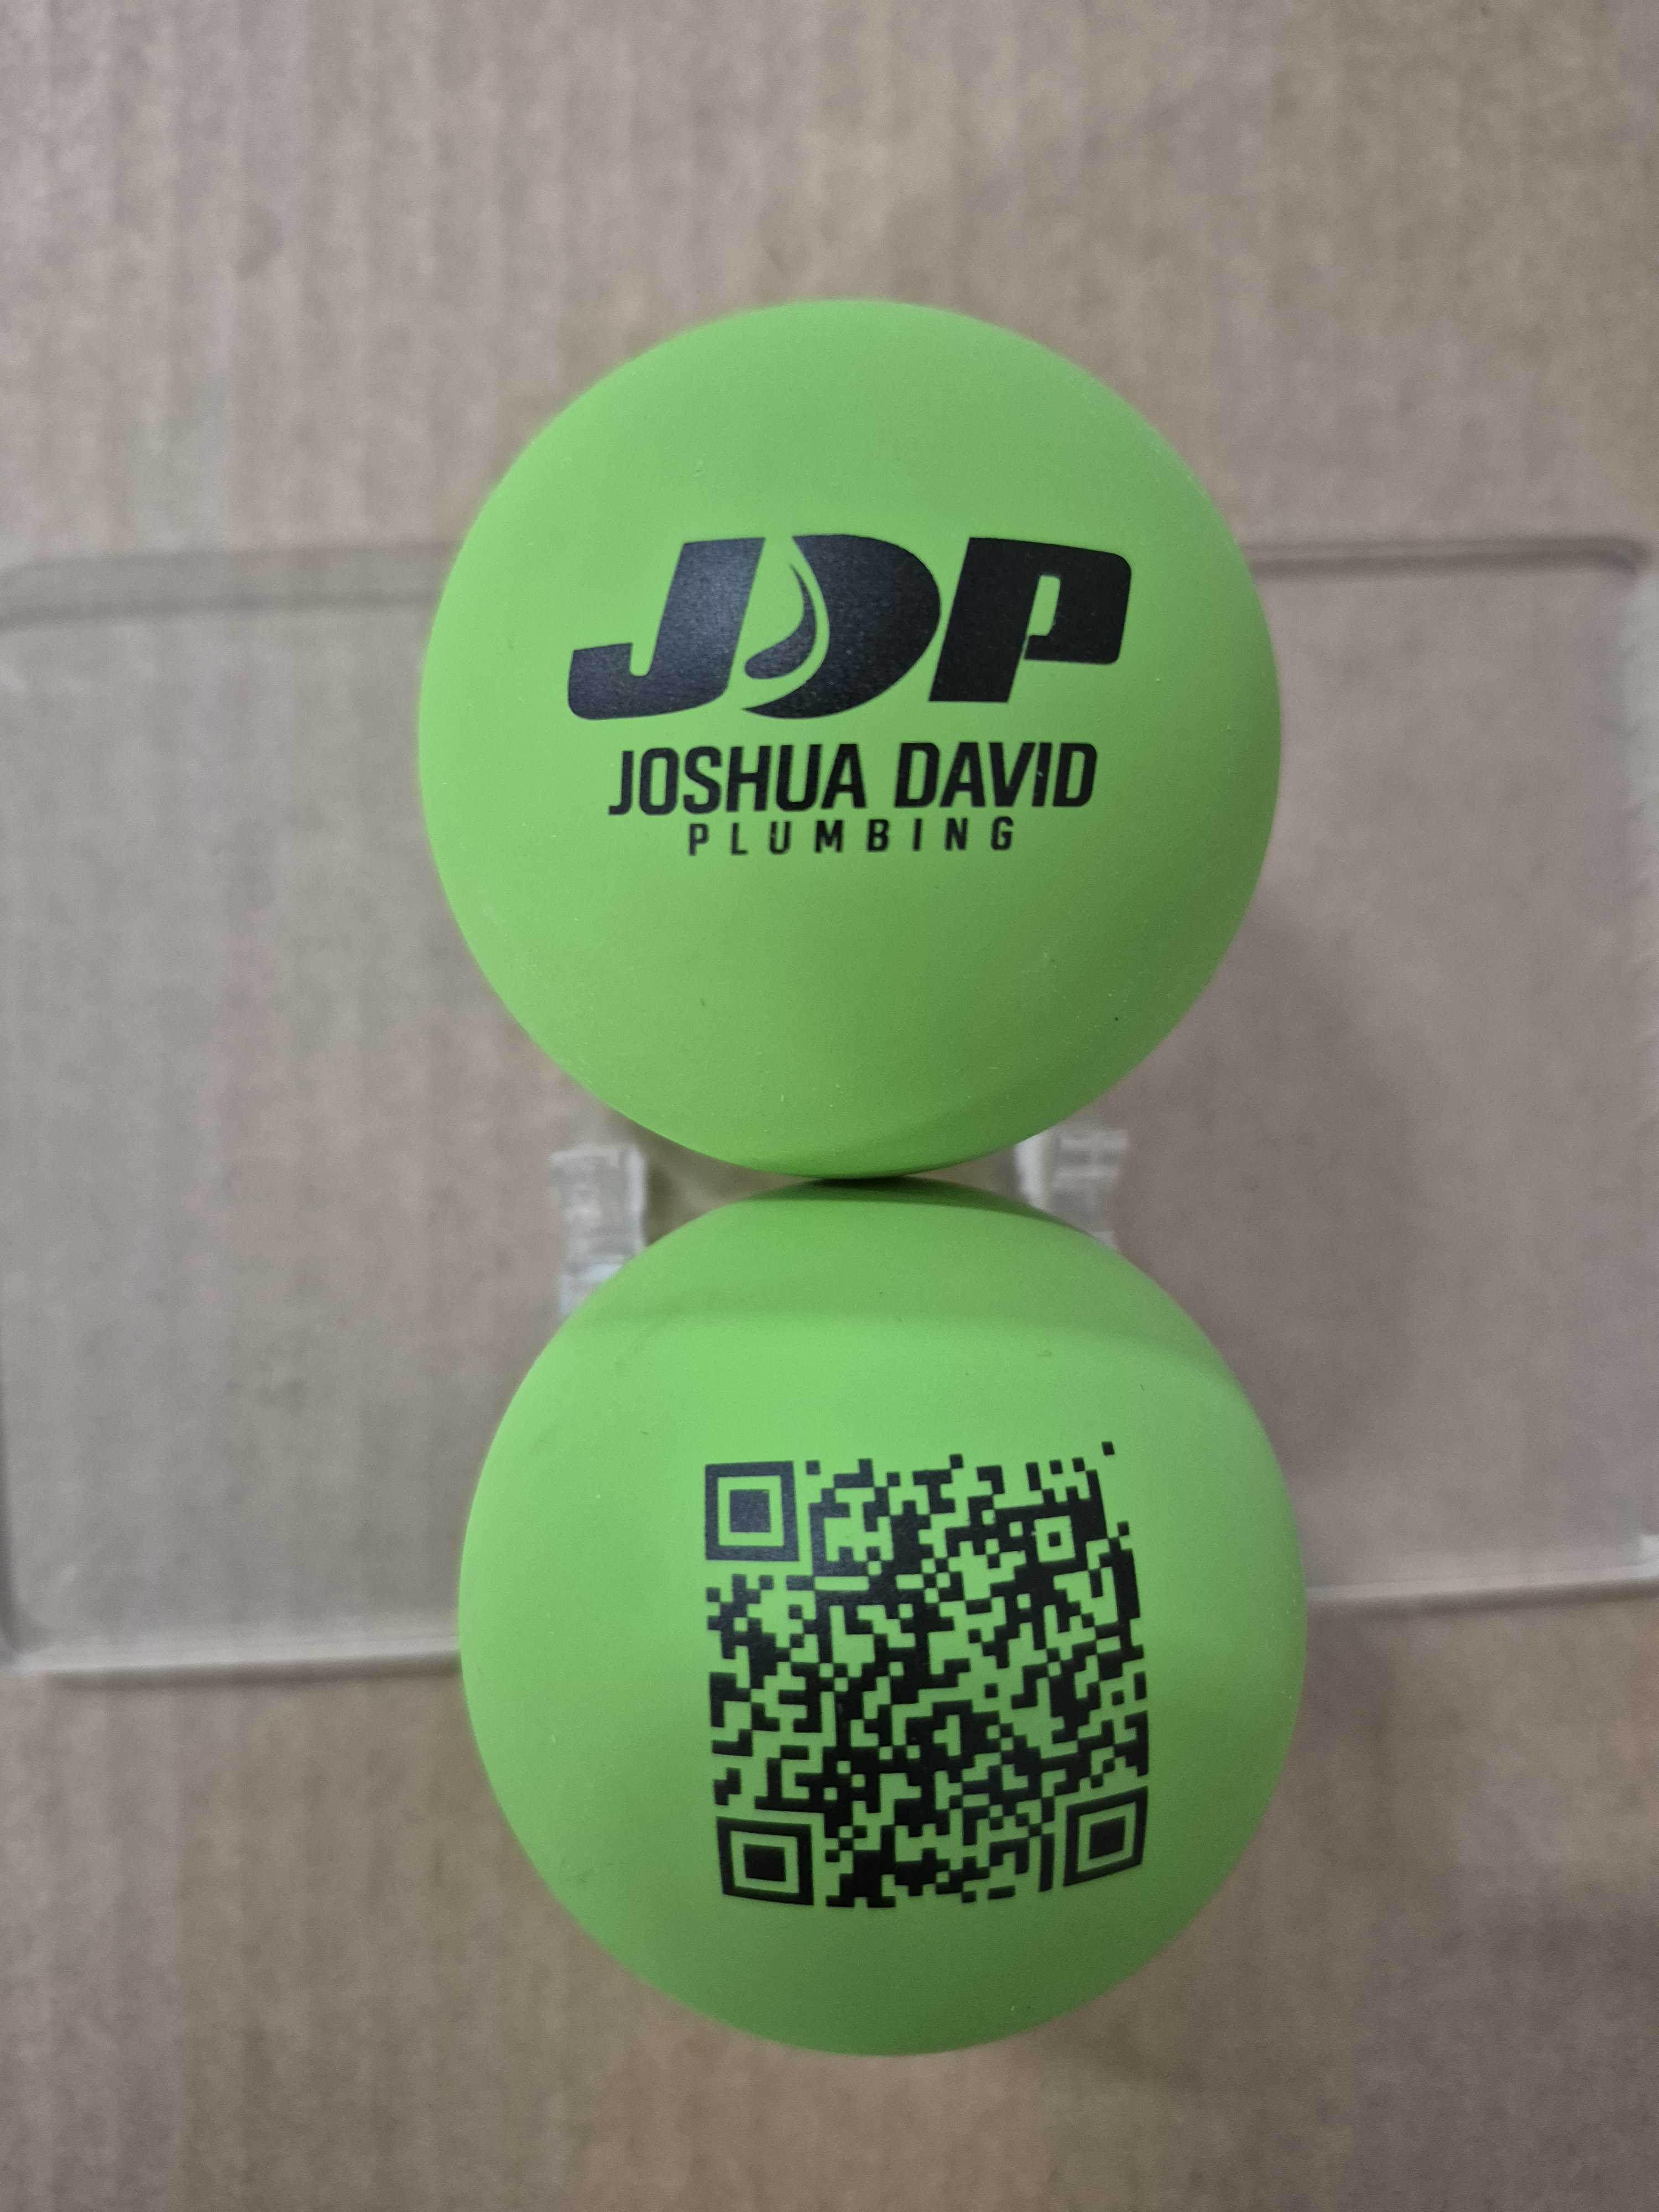
- Use a unique promo code per event, not one code for the whole year.
- Only hand out premium items like golf umbrellas in exchange for a scan or sign-up
- Tag recipients in your CRM on the day, not a week later
Count every cost, not just the unit price
- Unit price and decoration
- Setup or artwork charges
- Freight, including any rush freight
- Storage if stock sits in a warehouse
- Staff time packing and distributing
- Rush freight and reprint fees are the costs I most often see missing from ROI reports. Last-minute changes and slow approvals are usually what cause them, so if you’re tracking ROI properly, they belong in the total.
Agree the reporting window with finance
Merch doesn’t convert in a week. Agree upfront whether you’re reporting at 30, 90 or 180 days so nobody judges the drink bottles you gave out 1 week earlier.
A worked example
Here’s how the numbers look for a single trade show. These figures are illustrative only, but the method is the same one you’d use with your own.
From that:
- Cost per recipient: $4,500 ÷ 260 = about $17.30
- Cost per lead: $4,500 ÷ 118 = about $38.10
- Leftover stock: 40 ÷ 300 = about 13%
- Pipeline influenced: $36,000 from contacts who received a tumbler.
Report the $36,000 as influenced, not caused. CFOs quickly spot a claim that merch single-handedly closed a deal, and an honest number holds up better at budget time.
What your CFO actually wants to see
- One page, not a slide deck
- Cost per lead next to your other channels, like paid social or sponsorships
- The trend across several events, not one standout result
- What you’ll change next time based on the data
For Charles Liu, our co-founder, the last point matters a lot. A report that says “we ordered 40 too many, so we’re dropping to 260 next quarter” shows the spend is being managed, not just defended.

When the numbers don’t look good
Bad numbers are still useful if you read them properly.
- High leftover stock: order smaller runs or choose items that keep, like drink bottles or notebooks
- Low keep rate: the item didn’t suit the audience, so ask what they’d actually use
- High cost per lead: move premium items behind a scan and use cheaper items for walk-bys
- No redemptions: the code was too hard to find or the offer too weak
If you’re planning an event and want to build tracking into the order from the start, tell our account managers so we can recommend the perfect item and how you can brand it.
Ready To Buy?